 |
***
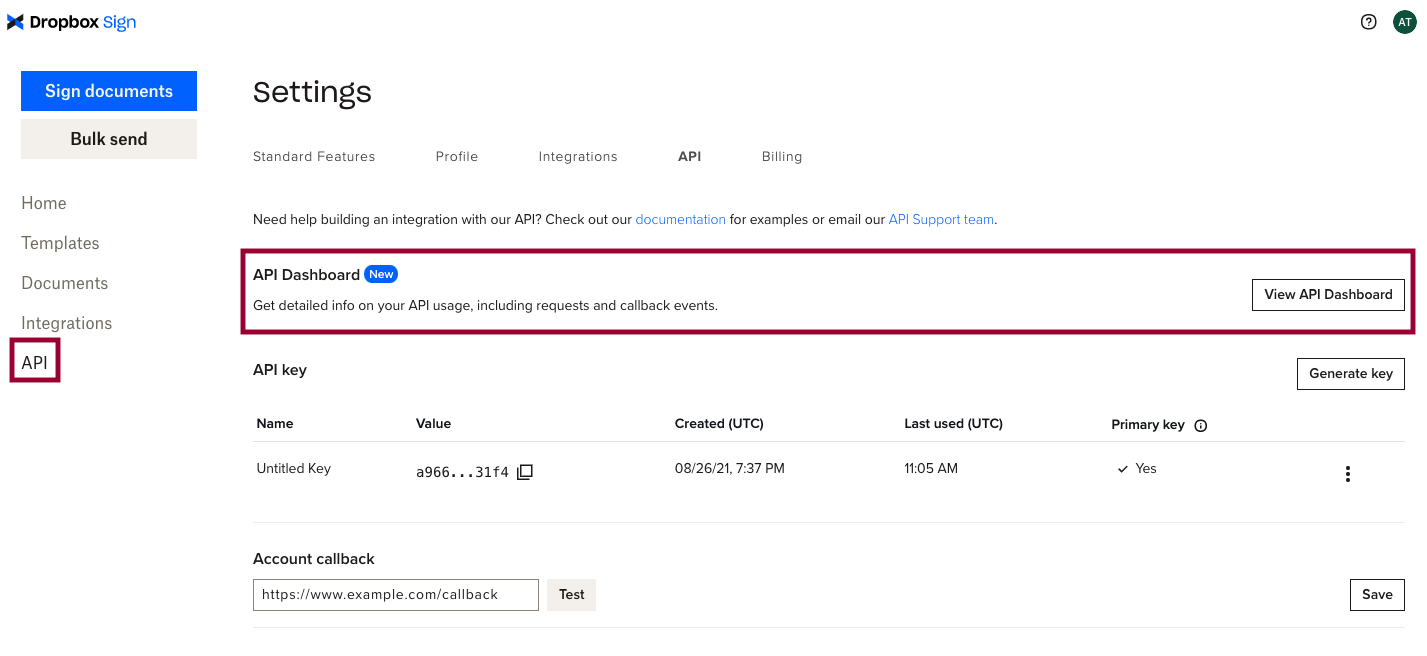
## Using the API Dashboard
This section contains information, examples, and tips on using the API Dashboard to discover valuable knowledge about your integration with the Dropbox Sign API.
### General Usage Tips
Here's a short of helpful tips to get you started:
| Topic | Notes |
| ------------------------------------ | -------------------------------------------------------------------------------------------------------------------------------------------------------------------------------------------------------------------------------------------------------------------------------------------------------------------------------------------------- |
| **Live data vs Test data** | The API Dashboard shows two types of data:
|
***
## Using the API Dashboard
This section contains information, examples, and tips on using the API Dashboard to discover valuable knowledge about your integration with the Dropbox Sign API.
### General Usage Tips
Here's a short of helpful tips to get you started:
| Topic | Notes |
| ------------------------------------ | -------------------------------------------------------------------------------------------------------------------------------------------------------------------------------------------------------------------------------------------------------------------------------------------------------------------------------------------------- |
| **Live data vs Test data** | The API Dashboard shows two types of data: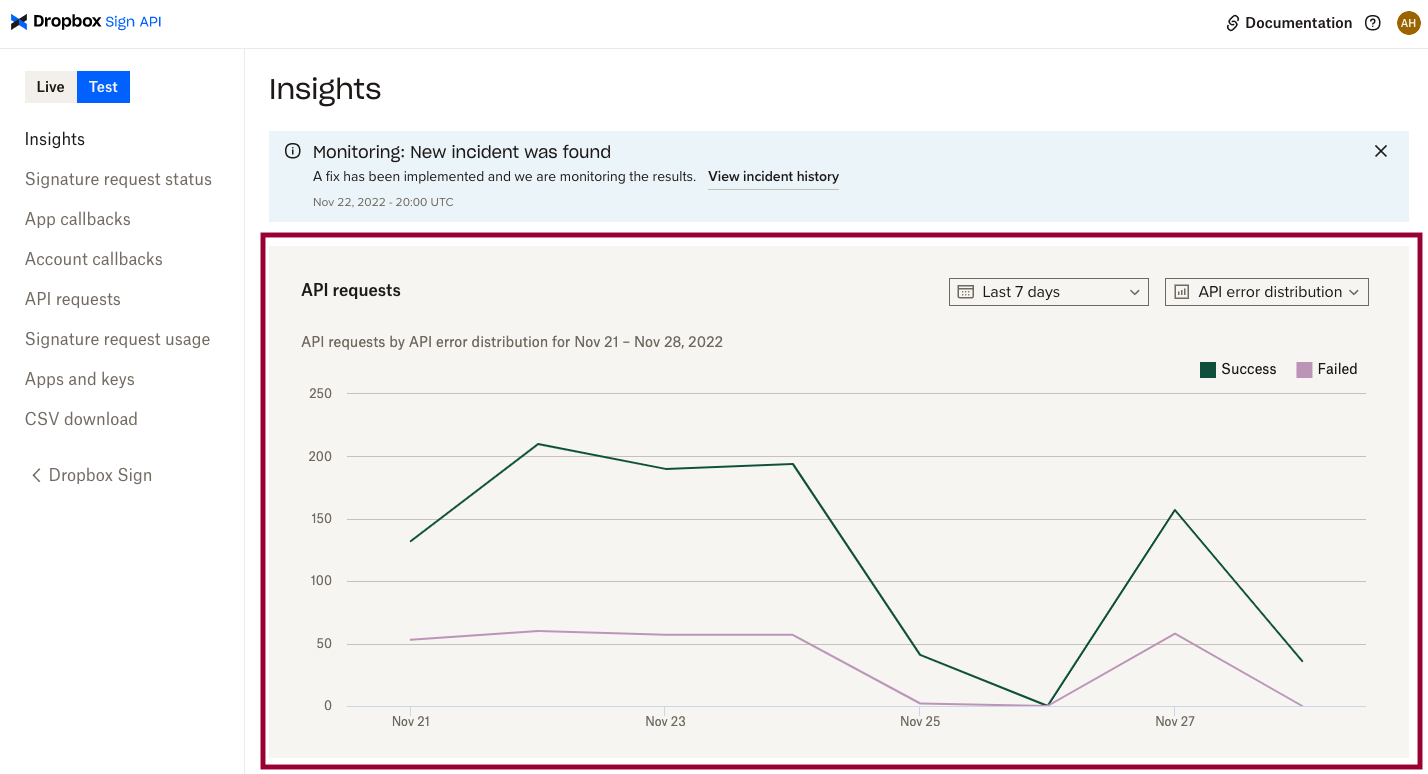 |
| Change the time frame.
|
| Change the time frame. 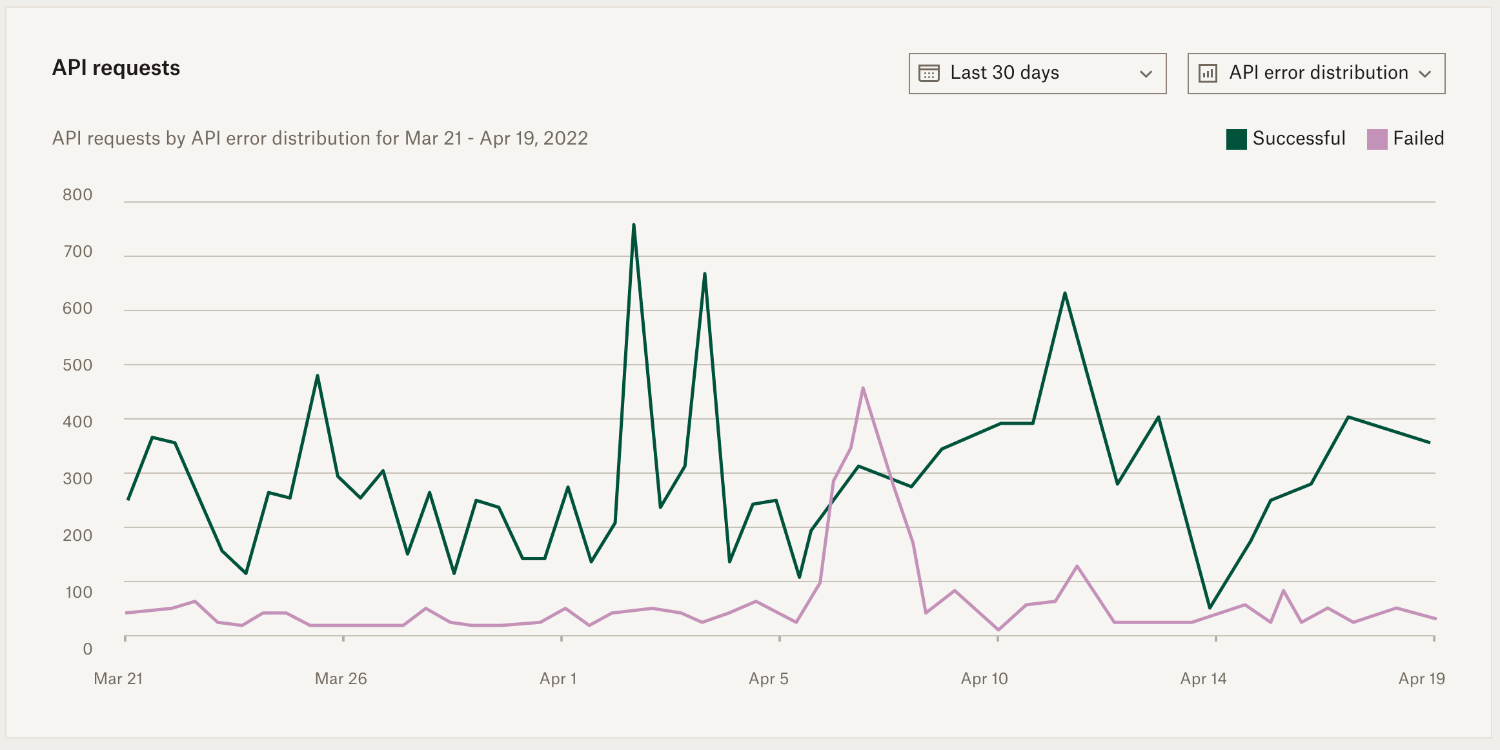 |
| Group data by endpoint.
|
| Group data by endpoint.  |
| Group data by status code.
|
| Group data by status code.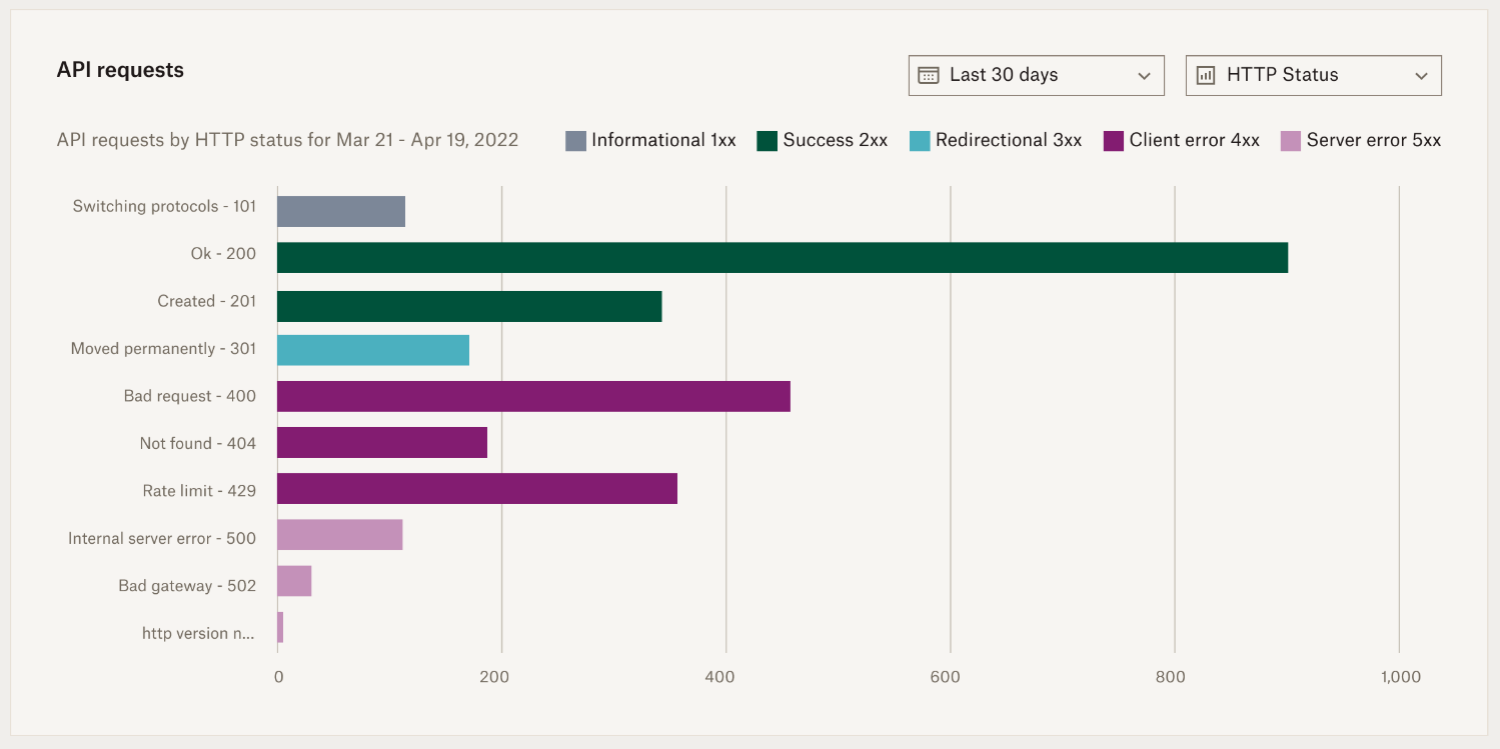 |
In the example above, the API requests chart gave us the following insights into the health of our integration:
* There was a spike in failed API requests around April 7th.
* The Get signature request endpoint had the most failed requests.
* The error is likely a rate limit or malformed request.
Now we've identified the problem and have a head start for debugging it.
#### Discover service disruptions to our API
*Any* changes to the health of the Dropbox Sign API (such as an outage, degradation of service, or planned maintenance) are immediately added to a banner at the top of the API Dashboard.
The table below demonstrates where to find and track incident information if there was a service issue.
| Notes | Screenshot |
| -------------------------------------------------------------------------------------------------------------------------------------------- | --------------------------------------------------------------------------------------------------------------------------------------------------------------- |
| Discover impacted service from the banner at the top of the page.
|
In the example above, the API requests chart gave us the following insights into the health of our integration:
* There was a spike in failed API requests around April 7th.
* The Get signature request endpoint had the most failed requests.
* The error is likely a rate limit or malformed request.
Now we've identified the problem and have a head start for debugging it.
#### Discover service disruptions to our API
*Any* changes to the health of the Dropbox Sign API (such as an outage, degradation of service, or planned maintenance) are immediately added to a banner at the top of the API Dashboard.
The table below demonstrates where to find and track incident information if there was a service issue.
| Notes | Screenshot |
| -------------------------------------------------------------------------------------------------------------------------------------------- | --------------------------------------------------------------------------------------------------------------------------------------------------------------- |
| Discover impacted service from the banner at the top of the page. 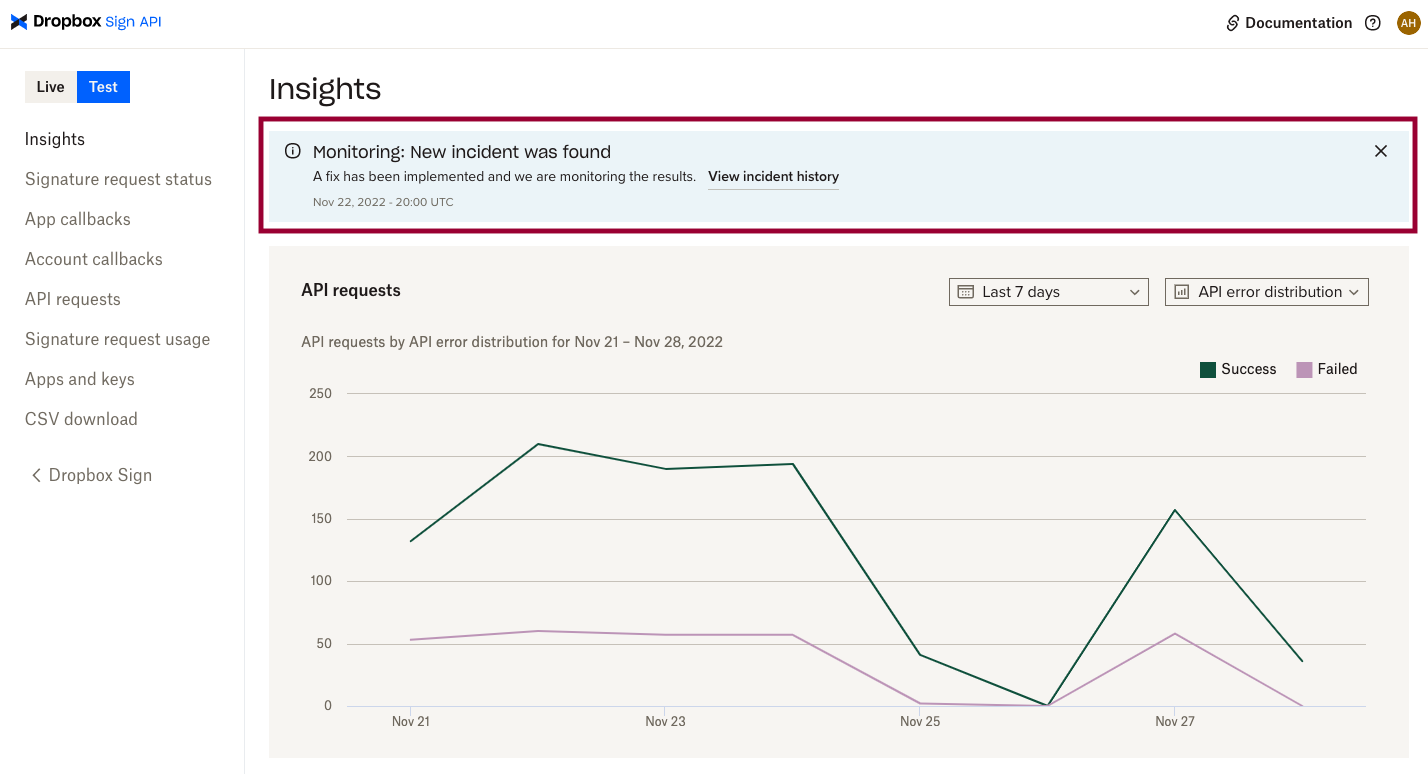 |
| The incident report page contains:
|
| The incident report page contains: 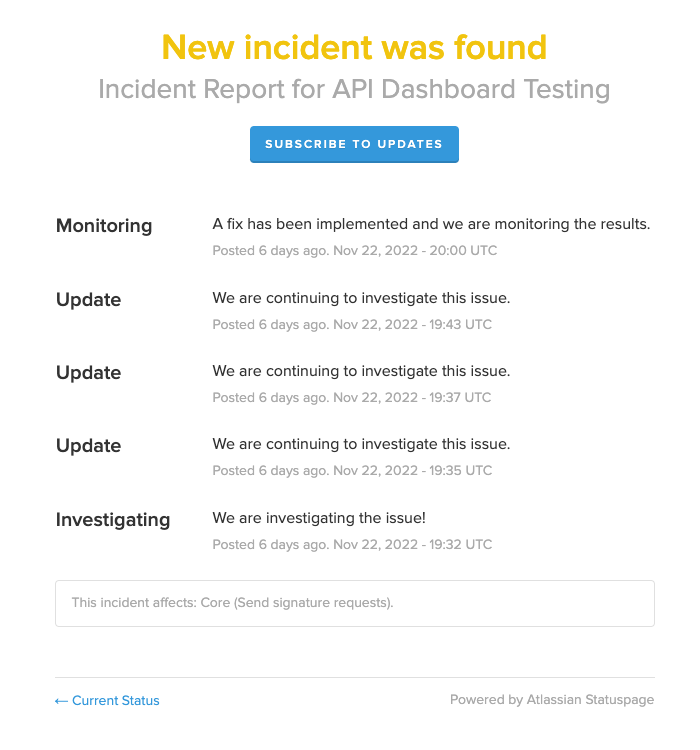 |
### Troubleshooting and Debugging
The API Dashboard offers a range of tools for interacting with your data—empowering you to troubleshoot and debug issues with your integration *directly*. Our API Support team is still available when you need it, but engaging them after you've done some of your own debugging means you can you can include identifiers, links, or information that can lead to a resolution more quickly.
**Use all your tools**
There are multiple paths to discovery when you're troubleshooting. Remember to use the full set of tools available to you.
* API requests chart
* Search
* Filters
* Clicking through connected data
#### Improve integration health using insights from failed API calls
Did you know you can click through chart results on the Insights page? That approach is one of the best ways to start troubleshooting health issues you see in charts (especially for failed api calls). The links direct you to the list of data populating the graph with filters already applied.
Let's step through an example of how you might approach troubleshooting a health issues.
| Notes | Screenshot |
| -------------------------------------------------------------------------------------------------------------------------------------------------------------------------------------------------------------------------------------------------------------------------- | --------------------------------------------------------------------------------------------------------------------------------------- |
| While using the API Dashboard you notice a spike in failed API calls and decide to investigate.
|
### Troubleshooting and Debugging
The API Dashboard offers a range of tools for interacting with your data—empowering you to troubleshoot and debug issues with your integration *directly*. Our API Support team is still available when you need it, but engaging them after you've done some of your own debugging means you can you can include identifiers, links, or information that can lead to a resolution more quickly.
**Use all your tools**
There are multiple paths to discovery when you're troubleshooting. Remember to use the full set of tools available to you.
* API requests chart
* Search
* Filters
* Clicking through connected data
#### Improve integration health using insights from failed API calls
Did you know you can click through chart results on the Insights page? That approach is one of the best ways to start troubleshooting health issues you see in charts (especially for failed api calls). The links direct you to the list of data populating the graph with filters already applied.
Let's step through an example of how you might approach troubleshooting a health issues.
| Notes | Screenshot |
| -------------------------------------------------------------------------------------------------------------------------------------------------------------------------------------------------------------------------------------------------------------------------- | --------------------------------------------------------------------------------------------------------------------------------------- |
| While using the API Dashboard you notice a spike in failed API calls and decide to investigate.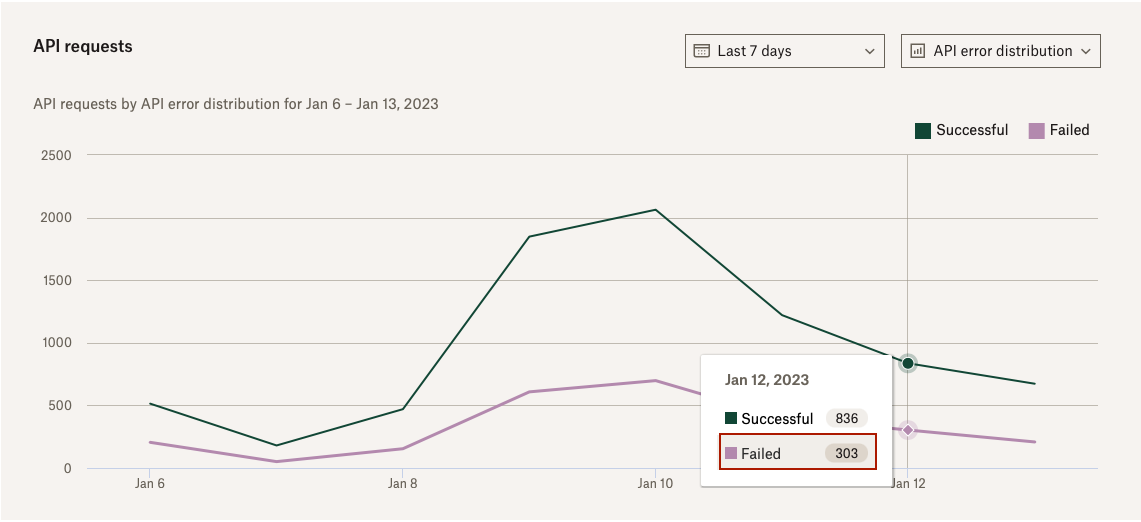 |
| The API requests page will list all failed API calls pre-filtered by:
|
| The API requests page will list all failed API calls pre-filtered by: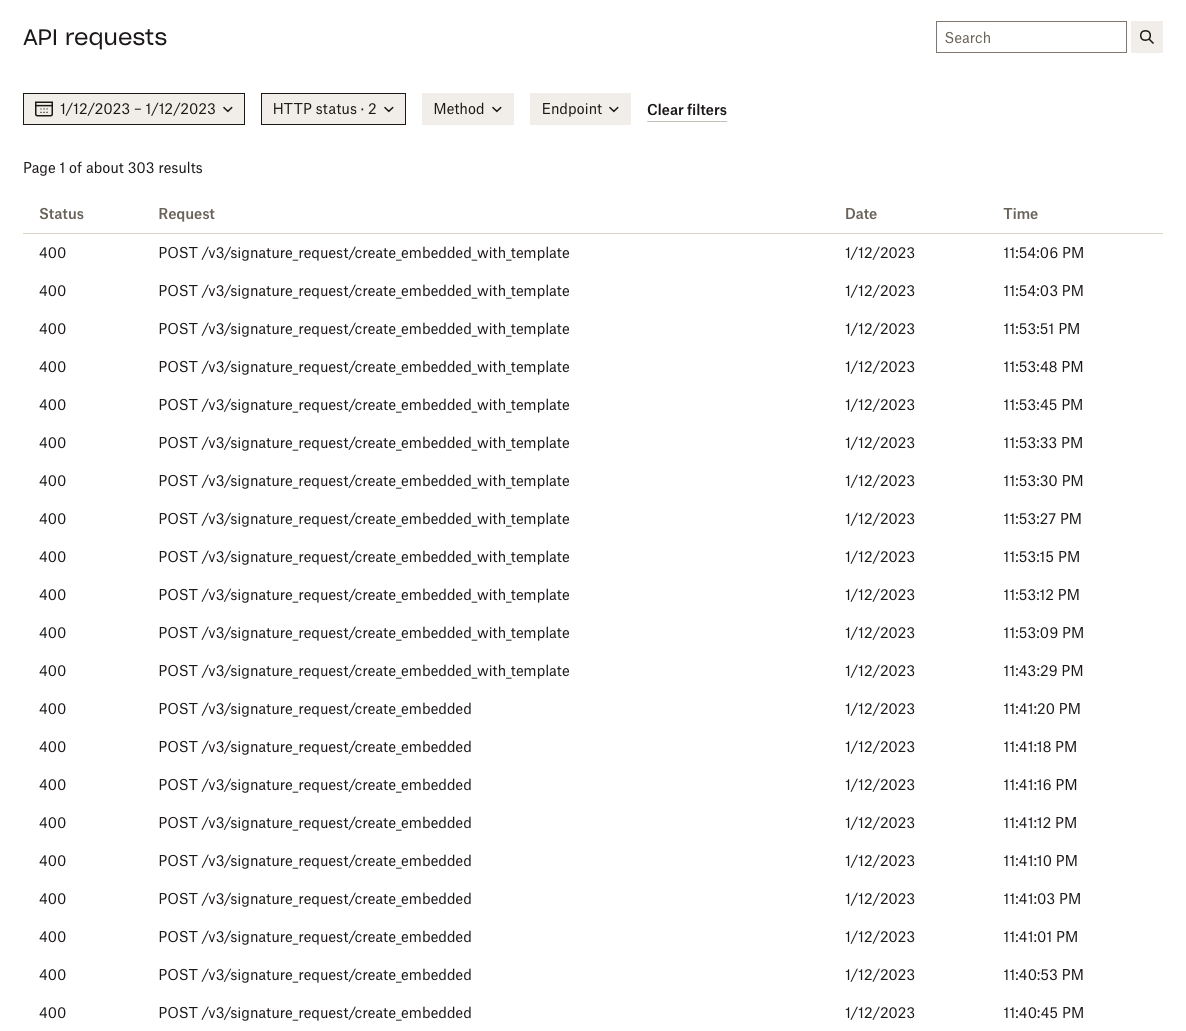 |
| Click on a single entry to learn more about that specific call. |
|
| Click on a single entry to learn more about that specific call. | 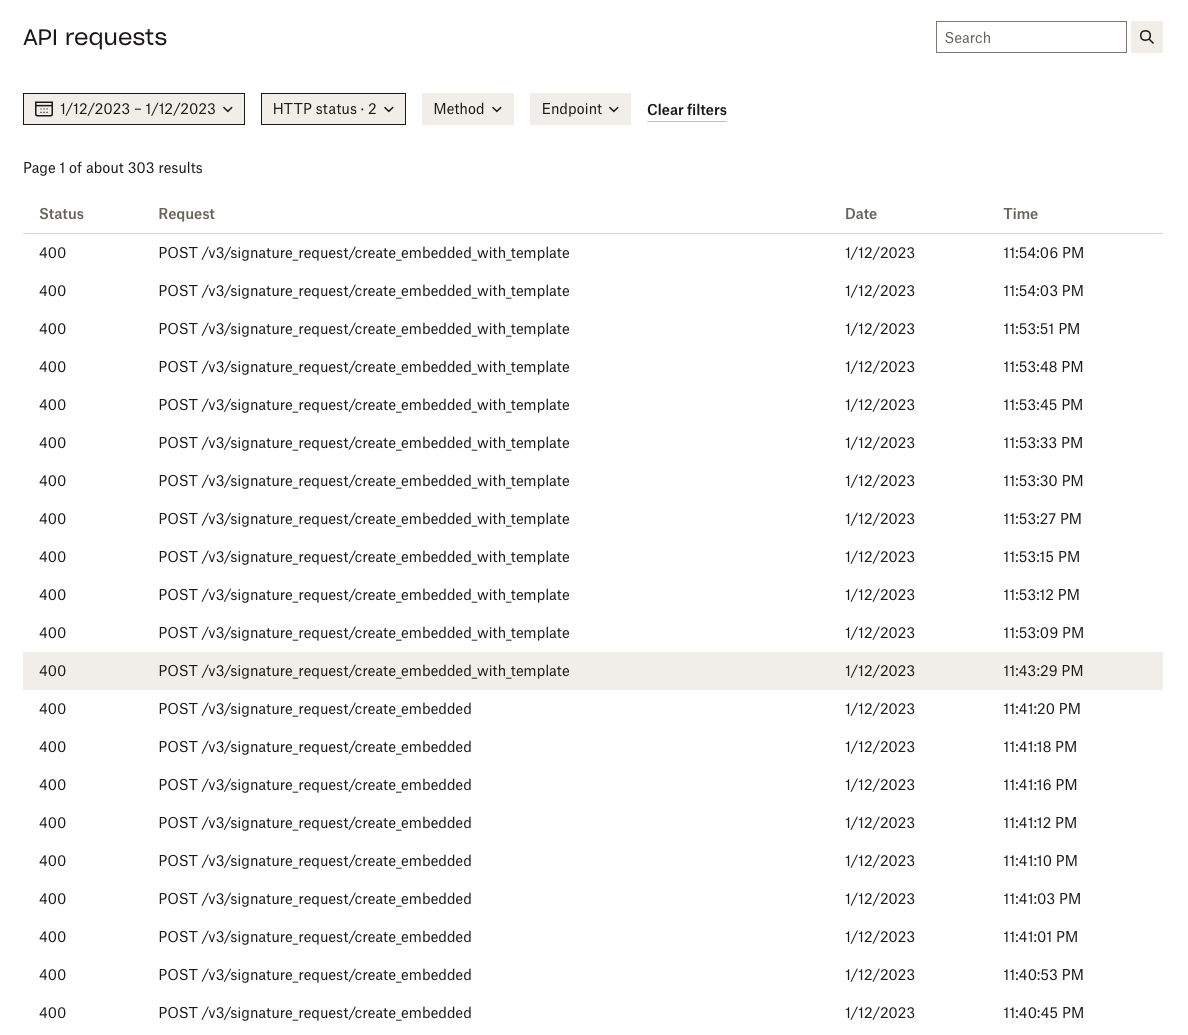 |
| Review details associated with that call.
|
| Review details associated with that call.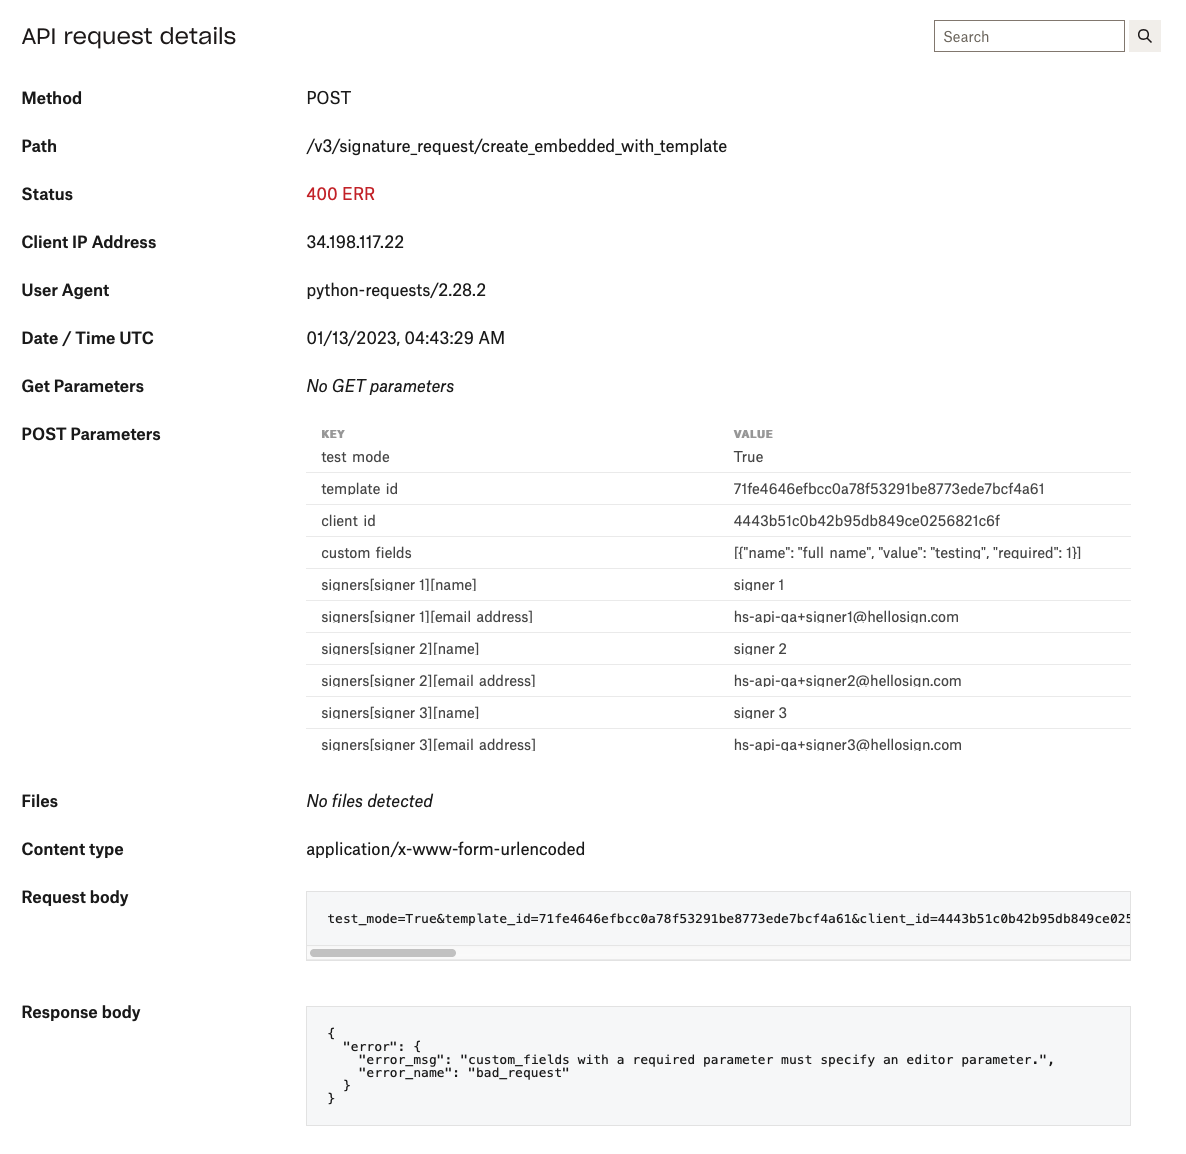 |
### Understanding Signature Request Activity
Having a clear understanding of your signature request activity is an essential part of maintaining a healthy integration. The API Dashboard can give you visibility into things like:
* Quota consumption
* Signature request health
* Historical trends in signature request usage
Exploring data around signature request usage (and signature requests themselves) is a great way to discover optimizations that lead to more completed signature requests. Think about it like troubleshooting a health issues in the signing experience you offer your users.
#### Track account subscription and quota consumption
The quota usage section of the API Dashboard gives you direct insight into your most important usage information for your current billing period. Here's what you'll find there:
* Number of signature requests and templates remaining.
* Usage data for any add ons you have (SMS delivery, eID, Qualified Electronic Signature, etc).
* Subscription information like quota refresh date, next billing date, and subscription tier.
#### Learn from trends in signature request usage
Exploring patterns around signature request usage can reveal valuable insights about your customers, your integration, and help you make proactive decisions around your subscription. Here are examples of the type of insights you might discover:
* Seasonal or recurring bursts of signer activity.
* Upgrade your API plan to meet demand before your busy season.
* Proactively make a plan for hitting rate limits.
* Historical signature request usage
* Identify a shift in your marketing strategy.
* Explore how a market condition impacted your signature request usage during a specific time frame
* Identify Customers with a high rate of growth
* If you have a model where your customers each have their own api app, then looking at signature request usage by `client_id` might give you signal on who needs your attention.
* Recurring patterns
* "Our signature requests peak every quarter. Let's hire a temp every 3 months."
### Team Admin Global View
So far we've discussed how the API Dashboard can be leveraged to better understand your own personal account activity. For Team Admins, we also provide the capability to expand those insights and details to include your entire team. With the Team Admin Global View, Team Admins can effectively collaborate within their teams and maintain a robust API integration; keeping their business running smoothly.
#### Team accounts
All Team Admins have access to view any of their team account's signature request details by selecting the account via a dropdown located below the Live and Test toggle switch in the top left corner of the API Dashboard.
| Notes | Screenshot |
| ------------------------------------------------------------------------------ | -------------------------------------------------------------------------------------------------- |
| Admin Global View dropdown selection located in the top left of the dashboard. |
|
### Understanding Signature Request Activity
Having a clear understanding of your signature request activity is an essential part of maintaining a healthy integration. The API Dashboard can give you visibility into things like:
* Quota consumption
* Signature request health
* Historical trends in signature request usage
Exploring data around signature request usage (and signature requests themselves) is a great way to discover optimizations that lead to more completed signature requests. Think about it like troubleshooting a health issues in the signing experience you offer your users.
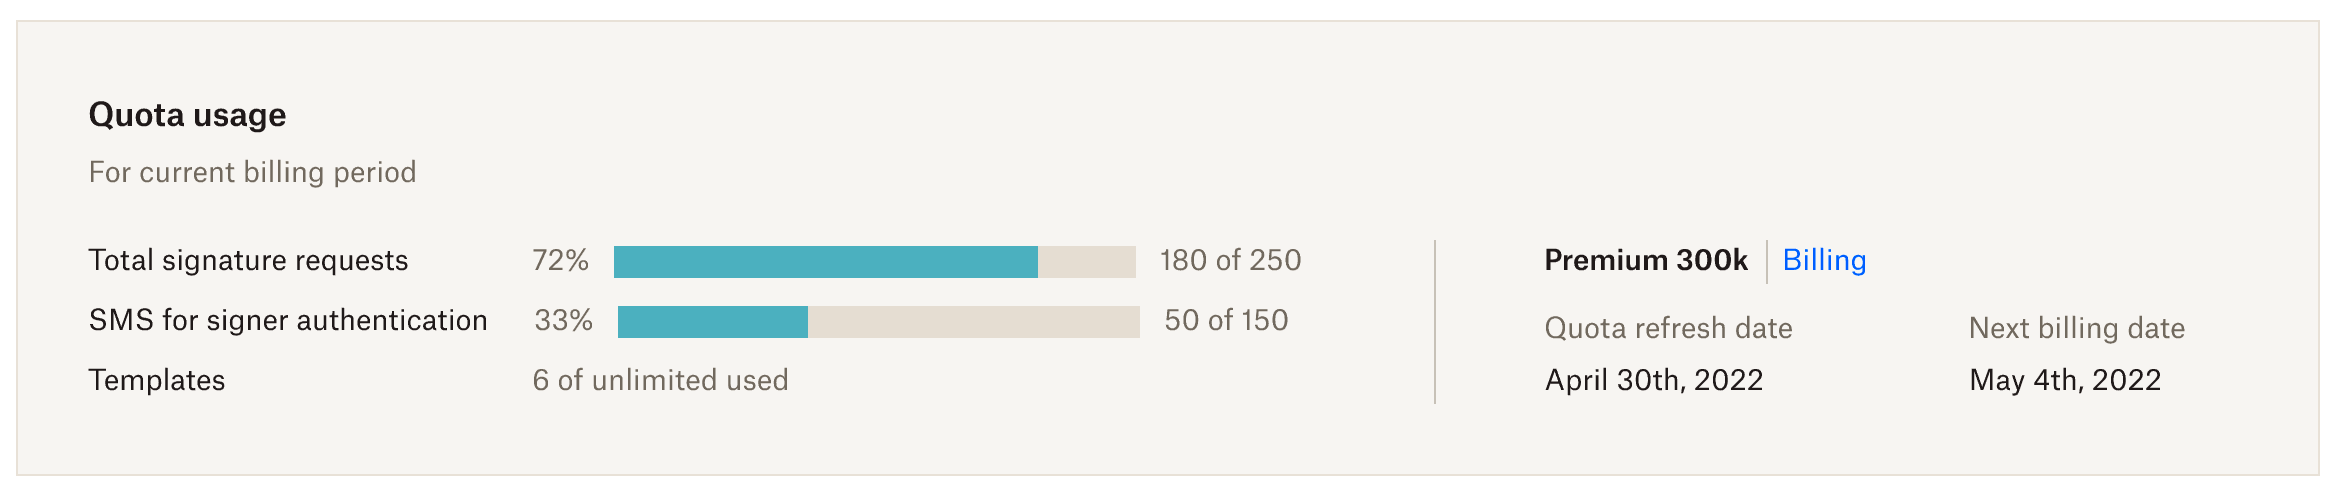
#### Track account subscription and quota consumption
The quota usage section of the API Dashboard gives you direct insight into your most important usage information for your current billing period. Here's what you'll find there:
* Number of signature requests and templates remaining.
* Usage data for any add ons you have (SMS delivery, eID, Qualified Electronic Signature, etc).
* Subscription information like quota refresh date, next billing date, and subscription tier.

#### Learn from trends in signature request usage
Exploring patterns around signature request usage can reveal valuable insights about your customers, your integration, and help you make proactive decisions around your subscription. Here are examples of the type of insights you might discover:
* Seasonal or recurring bursts of signer activity.
* Upgrade your API plan to meet demand before your busy season.
* Proactively make a plan for hitting rate limits.
* Historical signature request usage
* Identify a shift in your marketing strategy.
* Explore how a market condition impacted your signature request usage during a specific time frame
* Identify Customers with a high rate of growth
* If you have a model where your customers each have their own api app, then looking at signature request usage by `client_id` might give you signal on who needs your attention.
* Recurring patterns
* "Our signature requests peak every quarter. Let's hire a temp every 3 months."
### Team Admin Global View
So far we've discussed how the API Dashboard can be leveraged to better understand your own personal account activity. For Team Admins, we also provide the capability to expand those insights and details to include your entire team. With the Team Admin Global View, Team Admins can effectively collaborate within their teams and maintain a robust API integration; keeping their business running smoothly.
#### Team accounts
All Team Admins have access to view any of their team account's signature request details by selecting the account via a dropdown located below the Live and Test toggle switch in the top left corner of the API Dashboard.
| Notes | Screenshot |
| ------------------------------------------------------------------------------ | -------------------------------------------------------------------------------------------------- |
| Admin Global View dropdown selection located in the top left of the dashboard. | 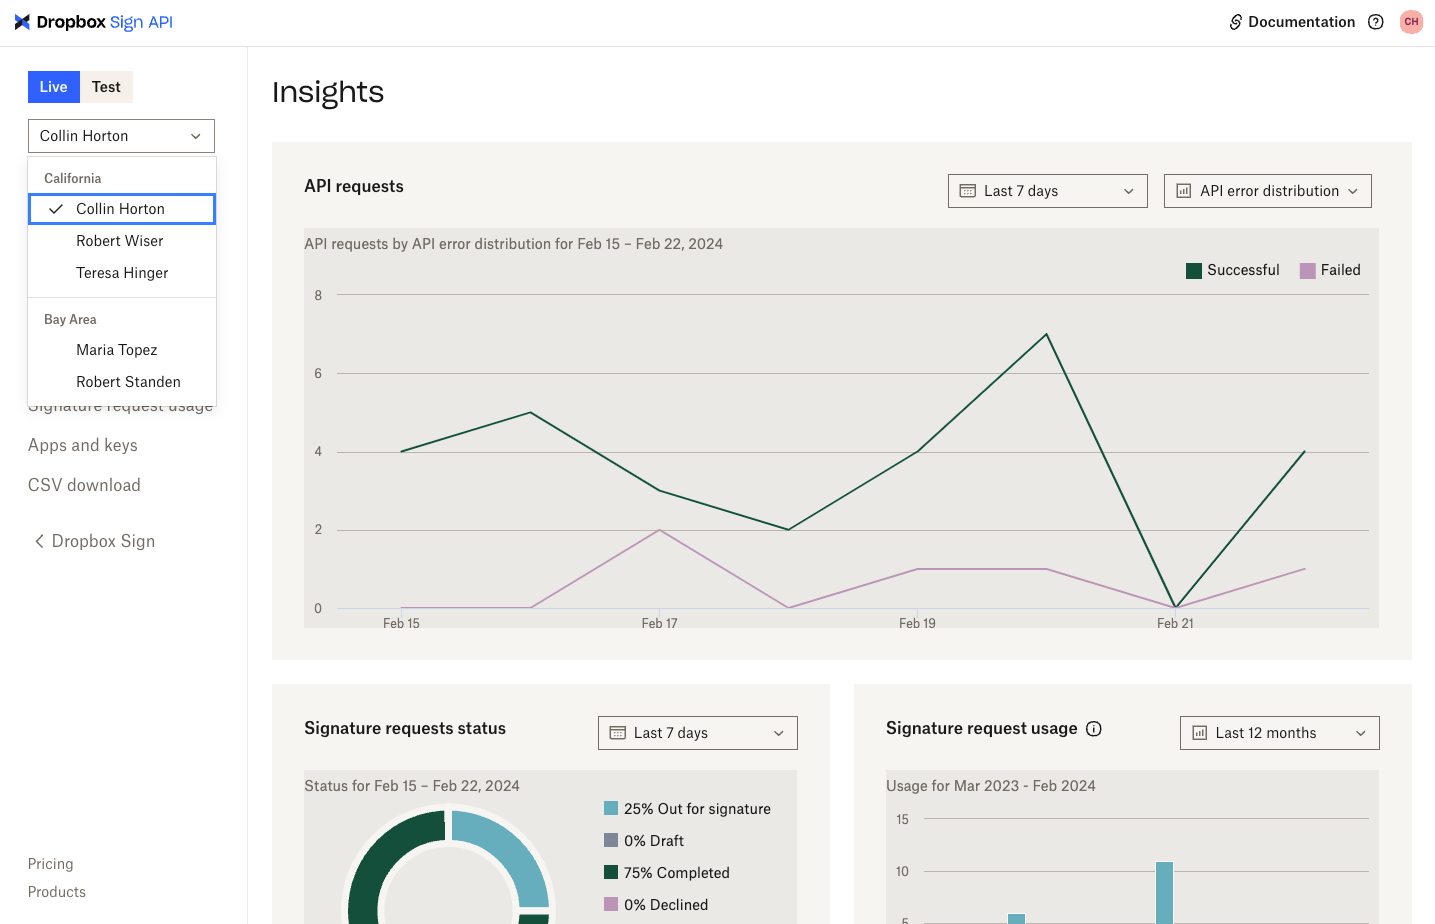 |
Once an account is selected, the information included on all pages within the dashboard will populate the signature request details for that specific account. For example, let's say you have 3 accounts: account A, account B, and account C. If you select account B in the dropdown, the pages within the dashboard will reflect signature request details for account B. If you change the dropdown to account C, each page will be updated to display account C's signature request details. Additionally, toggling between Live and Test will update the data to display either the production or test requests for the selected team member.
|
Once an account is selected, the information included on all pages within the dashboard will populate the signature request details for that specific account. For example, let's say you have 3 accounts: account A, account B, and account C. If you select account B in the dropdown, the pages within the dashboard will reflect signature request details for account B. If you change the dropdown to account C, each page will be updated to display account C's signature request details. Additionally, toggling between Live and Test will update the data to display either the production or test requests for the selected team member.
You **can't** search for:
|
You **can** search for:
|